Introduction
Bar or Gantt charts are another commonly used way of graphically representing a project schedule. Gantt charts are named after Henry Gantt who used bar charts extensively in the Second World War to plan the scheduling and control of military operations. For most purposes, bar and Gantt charts are the same thing.
A typical bar chart consists of columns and rows. The left column contains the task list. The other columns represent time intervals - days, weeks, months or years. The duration of each task is shown by drawing a horizontal bar along the timescale, starting at the date when that task should start and finishing at the date by which the task should be completed.
Sample Gantt chart for a residential construction project
![This Gantt chart has task/activity heading on the top left and a list of dates in February and March from 28 February to 25 March across the top of the chart. Vertical columns of dates for March 5 and 6 are lightly shaded, as are columns for March 12, 13, 19 and 20. These shaded columns represent weekend days which are not usually work days. There is also dark grey shading across the table for several days at a time indicating planned work. If the shading is done over the same period of time for any tasks it is indicating that these tasks can be done concurrently. The tasks which are grouped under the first sub-heading of 'arrange services' down the left side of the table are 'connect electricity' which is shaded for three days from February 28, 'connect water supply' which is shaded for four days from February 28 , 'book portable toilet' which is shaded for two days from February 28 and 'fencing and signs' which is shaded for five days from February 28. The next sub-heading is 'set out site' and the tasks are 'locate and inspect building site' which is shaded for two days from March 7, 'clear and level site' which is shaded for two days from March 9, 'set out string lines' which is shaded for one day on March 14. The final sub-heading is 'excavation' under which are listed the tasks 'excavate over site' which is shaded for four days from March 15 and 'excavate footings' which is shaded for four days from March 21. For example, the shading is showing that the excavation cannot be started until the string lines have been set out.](images/page001_gantt_chart.jpg)
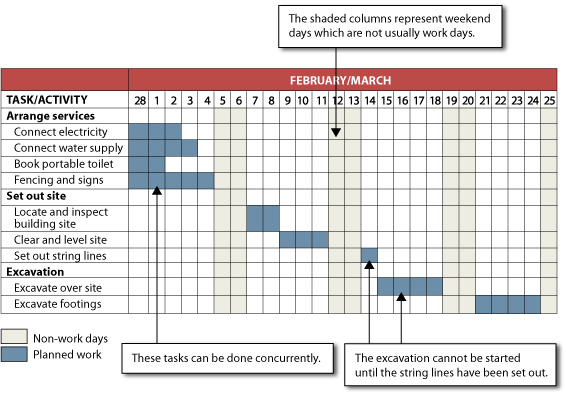
Relationships and dependencies between tasks are shown graphically by the positioning of the bars. For example two parallel bars indicate that two tasks will be done at the same time. One bar following another indicates that the task associated with the first bar must be completed before the task belonging to the second bar can be started.
Where resources (eg labour and equipment) allow, project managers often aim for work to be done on two or more tasks at the same time in order to shorten the overall duration of the project.