Start dates
When preparing a network we are able to plan for the earliest and latest times an event may start. This is referred to as the 'float' within the network. It shows you a given period of time in which a certain event must start if the project is to stay on track.
Here is a simplified diagram which sets out a five event network. The number of days required for each task is shown between each event.
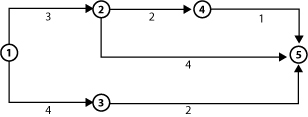
To help plan the earliest start date for each event we need to keep track of the total number of days for each section of the process.
Starting at event 1, look at the number shown on the path between events 1 and 2. This tells you how many days are required to complete the activity.