.
S18 Tests of proportion
September 16, 2021 - 12:36pm — AJ (e67821)

Image by Pixabay
A test of proportion is used to determine whether or not a sample from a population represents the true proportion from the entire population.
How to Perform a Test of Proportions
The steps to perform a test of proportion are:
Hypotheses
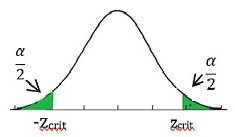
State the null and alternative hypotheses. For example, if \(\hat{p}\) is the sample proportion and \(p\) the null hypothesised population proportion, then for a 2-sided test:1 Note: Some texts and courses may use other notation such as \(\pi\) to represent the population proportion, and \(p\) to represent the sample proportion. \[\begin{align*} H_{o} & :\hat{p}=p \end{align*}\] (the proportion of the population from which the sample is drawn is the same as the given population proportion) \[\begin{align*} H_{a} & :\hat{p}\neq p \end{align*}\] (the proportion of the population from which the sample is drawn is not the same as the given population proportion)A significance level \(\alpha\) is chosen
z-tables are used to find the critical values
For the assumption that the test statistic is normally distributed to be valid we require \(np>5\) and \(n(1-p)>5\). (Check your course notes)
Calculate the test statistic: \(z=\frac{(\hat{p}-p)}{\sqrt{\frac{p(1-p)}{n}}}\)
A decision is made regarding the “reasonableness” of the test statistic if \(H_{o}\) is true:
Is the test statistic more extreme than the critical value?
Yes \(\Rightarrow\) Reject \(H_{o}\)
No \(\Rightarrow\) Do not reject \(H_{o}\)State your conclusion: There is (if you reject)/is not (if you do not reject) evidence to suggest that “…………………”. Paraphrase the words in the question to complete the sentence.
Example
A lecturer knows that historically \(60\)% of students do not begin their statistics assignment until within seven days of the due date. As a result they do not do well. To address this unfortunate reality, maths support services are widely promoted during the early weeks of the semester. A survey of 80 randomly selected students revealed that 42 had started the assignment before the final week. Is there evidence to suggest the promotion has been effective at the \(10\)% significance level?
In this case \(\hat{p}=\frac{42}{80}=0.525\).
Hypotheses:
\(H_{o}:p=0.6\) (the proportion of the population from which the sample is drawn is the same as the given population proportion)
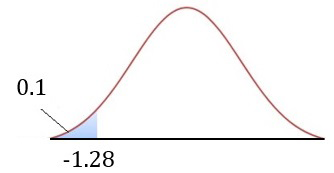
\(H_{a}:p<0.6\) (the proportion of the population from which the sample is drawn is less than the given population proportion)Significance level
\(\alpha=0.10\)Critical values
Assumption of normality is satisfied: \(np=48>5,n(1-p)=32>5\)
From tables we find \(z=-1.28\).
Test statistic: \(z=\frac{\hat{p}-p}{\sqrt{\frac{p(1-p)}{n}}}=\frac{0.525-0.6}{\sqrt{\frac{0.6(1-0.6)}{80}}}=-1.37\)
\(-1.37\) is more extreme than \(-1.28\), therefore we reject \(H_{o}\) .
There is evidence to suggest that the promotion has been effective and that students are beginning their assignments earlier.
Exercises
A survey conducted ten years ago showed that \(18\)% of students were the first in their family to attend a university. To evaluate widening participation programs a randomly selected sample of \(120\) enrolment records indicated that in \(2017\) this number had increased to \(24\)%. Do these data provide convincing evidence to suggest that the percentage of ‘first in family’ students has changed over the last five years? Use \(\alpha=0.10\).
\(z=1.71\Rightarrow\textrm{reject }H_{o}\)
A car manufacturer advertises that at least \(80\)% of vehicles will obtain fuel economy of \(7\,l/100\,km\) or better. To test the claim, a consumer interest group randomly selects \(22\) vehicles and finds that only \(15\) achieve this figure. Is there evidence that the companies claim is false at the \(5\)% level of significance?
\(z=-1.41\Rightarrow\textrm{do not reject }H_{o}\).
In a rural community hospital \(6\) out of \(7\) babies born in a particular week were boys. Assuming that in the general population the probability of female and male babies is equal, test the claim that babies born at this hospital are more likely to be boys at the \(10\)% level of significance.
\(z=1.90\Rightarrow\) reject \(H_{o}\)(!). Note: Assumption of normality is NOT met .
Download this page: S18 Tests of proportions (PDF 137KB)
What's next... S19 Poisson distribution