.
S17 One sided tests
September 16, 2021 - 12:35pm — AJ (e67821)

Image by Pixabay
In the hypothesis tests we have looked at so far, we have been concerned to find evidence that there has been a change in the population mean. The null and alternative hypotheses have been
\(H_{o}:\mu_{\overline{x}}=\mu\) (the sample mean is the same as the population mean allowing for chance variation)
\(H_{a}:\mu_{\overline{x}}\neq\mu\) (the sample mean is not the same as the population mean allowing for chance variation)
Such a test is looking for a change in either direction: has the population mean increased or has the population mean decreased?
One Sided Claims
For claims such as:
Queenslanders have a \(greater\) chance of skin cancer.
The drop-out rate for Business students is \(lower\ than\) the university average.
Drug A is \(more\ e\!f\!f\!ective\) than drug B.
Battery X \(lasts\ longer\) than 300 minutes.
Superannuation company Bib \(outper\!f\!ormed\) superannuation company Bob in 2017.
we would use a one sided hypothesis test. All the highlighted words imply change in one direction. Hypothesis tests in which we are only concerned with change in ONE direction are called one sided or one tailed tests.
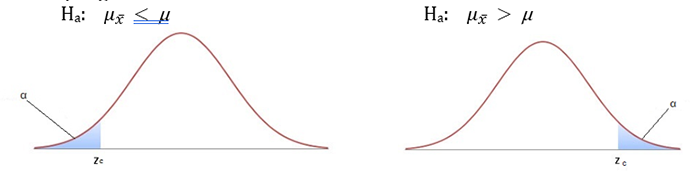
The null and alternative hypotheses for one sided tests may be:
\(H_{o}:\mu_{\overline{x}}\leq\mu\) (the sample mean is not greater than the population mean after allowing for chance variation)
\(H_{a}:\mu_{\overline{x}}>\mu\) (the sample mean is greater than the population mean after allowing for chance variation)
OR
\(H_{o}:\mu_{\overline{x}}\leq\mu\) (the sample mean is not less than the population mean after allowing for chance variation)
\(H_{a}:\mu_{\overline{x}}>\mu\) (the sample mean is less than the population mean after allowing for chance variation)
Conventions on how to write one sided hypotheses vary so always check with your program.
Critical Values
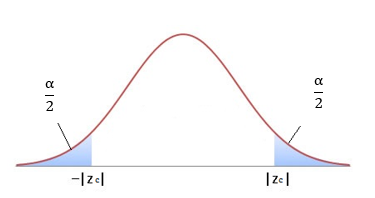
In a two sided test with a significance level of \(\alpha\), there are two critical values and the area of each upper and lower rejection region is \(\frac{\alpha}{2}\).
In one sided tests with a significance level of \(\alpha\) there is only one critical value and the region of rejection with area \(\alpha\) is on either the left OR the right side of the sampling distribution
Example
A baking company claims that the amount of meat in its pies is at least \(50g\). However a consumer group has had many complaints and decides to conduct a test to check if the pies are being under filled. A random sample of \(10\) pies resulted in the following data:
\[\begin{array}{cccccccccc} 45 & 52 & 51 & 44 & 50 & 52 & 48 & 45 & 43 & 47\end{array}\]
Is there evidence in this sample that the pies are being under filled? Use \(\alpha=0.05\).
From the data: \(\overline{x}=47.7s\) and \(s=3.4\).
Hypotheses
\(H_{o}:\mu_{\overline{x}}\leq50\)
\(H_{a}:\mu_{\overline{x}}>50\)Significance level
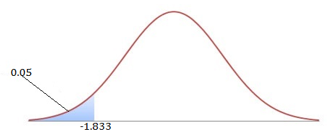
\(\alpha=0.05\) and a one sided t-test is appropriate.Critical values
From tables: \(\alpha=0.05\), degrees of freedom \(=n-1=10-1=9\Rightarrow t_{crit}=-1.833\).
Test statistic:
\(t\)= \(\frac{\overline{x}-\mu}{s_{\overline{x}}}=\frac{47-50}{\frac{3.4}{\sqrt{10}}}=-2.14\).Decision
Is the test statistic \((-2.14)\) more extreme than the critical value \((-1.833)\) ?
Yes, therefore we reject \(H_{o}\).Conclusion
There is evidence to suggest that the pies are being filled with less than \(50g\) of meat.
Exercises
Nutrition guidelines for an aged care facility recommend that no more than \(71.1mg\) of a particular vitamin be consumed each day. A random sample of seven residents revealed \(\overline{x}=71.3\) and \(s=0.214\). Use a test with \(\alpha=0.05\) to decide if there is evidence of a problem with the dietary intake at this facility?
One sided t-test. Test stat = 2.47, t crit = 1.943. \(\Longrightarrow\) reject \(H_{o}\)
A long term analysis of Rabbit University students’ study habits revealed that on average students study for 18 hours per week with a standard deviation of 4.2 hours. However, a random sample of 45 students in 2017 had a mean weekly study time of 14.68 hours. At the 1% significance level does this data suggest that students at Rabbit University are now studying less?
One sided t-test. Test stat = -5.30, t crit = -2.414, \(\Longrightarrow\) reject \(H_{o}\)
An IVF process resulted in \(50\) successful live births of which \(33\) were females. Use the p-value method to decide at the 1% level of significance whether female children are more likely to result from this procedure.
One sided z-test of proportion. Test stat = 2.263, p = 0.012 \(\Longrightarrow\) do not reject \(H_{o}\)
A maths Drop-in service is considering opening each evening, but only if attendance would be at least 20% of the weekly daytime average. A random survey of 400 attendees indicated that 92 would attend in the evening. Use the p-value method \((\alpha=0.1)\) to decide what the Drop-in service should do.
One sided z-test of proportion Test stat = 1.5, p = 0.067\(\Longrightarrow\) reject \(H_{o}\)
Download this page: S17 One-Sided Tests (PDF 22B)
What's next... S18 Tests of proportion