.
S9 Normal distributions
September 16, 2021 - 11:04am — AJ (e67821)
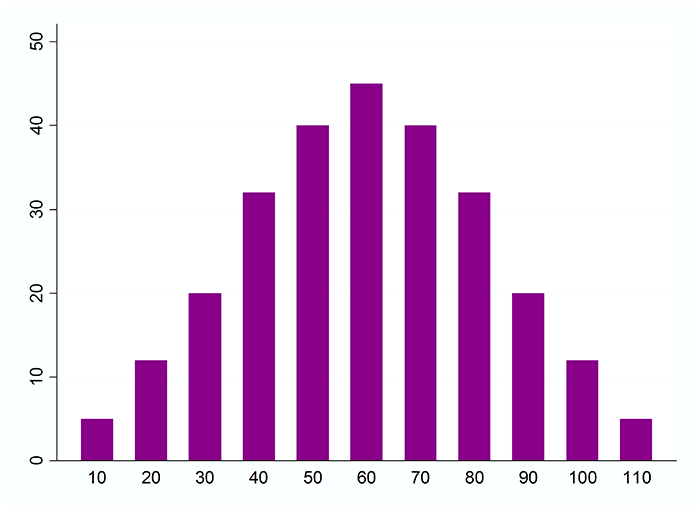
This module introduces the normal distribution. Data that is normally distributed is characterized by a bell shaped curve when displayed graphically.
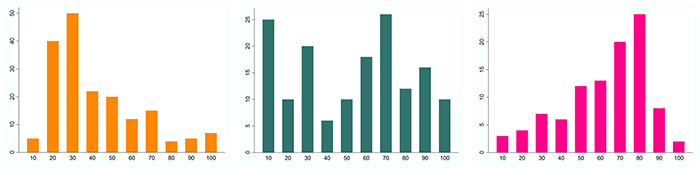
Graphical representations of data may look quite different as shown below:
But many things that can be measured, such as
heights of people
blood pressure
errors in measurement
scores on a test
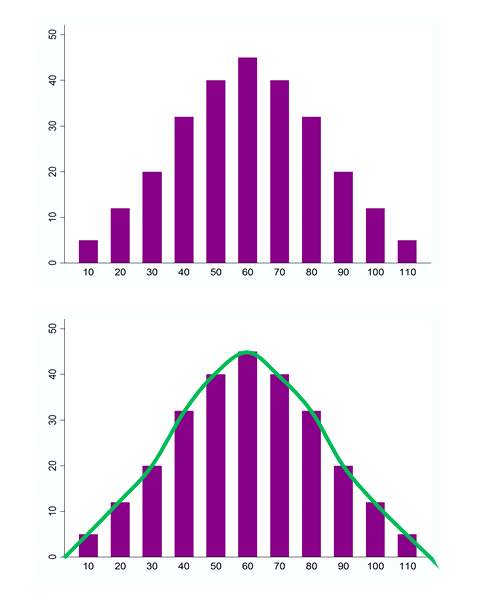
follow a bell shaped curve like the figure below.
Such data is said to be normally distributed.
Properties of a Normal Distribution
Symmetry about the mean
Mean = median = mode
50% of values greater than the mean and 50% less than the mean
68% of values fall within one standard deviation either side of the mean (approximately)
95% of values fall within two standard deviations either side of the mean (approximately)
99.7% of values fall within three standard deviation either side of the mean (approximately)
Note: Even though most of the data will fall within three standard deviations of the mean there is in theory, no upper or lower bound to a normal distribution. We are just less and less likely to find values beyond these points.
Example
If scores on an IQ test are normally distributed with mean \(=100\) and standard deviation \(=10\), what percentage of people would we expect to
score between 90 and 110?
score less than 80?
Solution:
Because \(90=100-10\) and \(110=100+10\) are both one standard deviation from the mean, \(68\)% of people would be expected to score between \(90\) and \(110.\)
\(80=100-2\times10\) is two standard deviations below the mean. We know that 95% of scores fall between \(80\) and \(120\) so \(5\)% must fall outside this range. Half of these, \(2.5\)%, will be below \(80\). Therefore we would expect that \(2.5\)% of people to have IQ scores less than \(80\).
Exercises
1. Scores on a general achievement test are normally distributed with a mean of \(80\) and a standard deviation of \(15\). Adam scored \(95\). What proportion of students had a higher score than Adam?
16%
2. The actual weights of cereal boxes that are supposed to contain \(500g\) are normally distributed with mean of \(510g\) and a standard deviation of \(5g\). What proportion of boxes are under-filled?
2.5%
3. In a maths class the bottom \(16\)% of students are given an F grade. If the class mean is \(63\) and the standard deviation is \(18\) what score must a student get to pass?
45
4. If newborn birth weights in a certain hospital are normally distributed with a mean of \(3200g\) and a standard deviation of \(400g\)
what percentage of babies weigh more than \(3200g\)?
what percentage of babies weigh between \(2400g\) and \(4000g\)?
what percentage of babies weigh less than \(3600g\)?
if the \(16\)% of babies with the lowest birth weights are placed in the special care nursery will a baby that weighs \(2500g\) need special care?
(a) 50% (b) 95% (c) 84% (d) yes
5. \(95\)% of people in a clinical study had systolic blood pressure readings between \(116\) and \(144\). If the blood pressure measurements follow a normal distribution what is the mean and standard deviation of the blood pressures for this group.
\(\mu=130,\sigma=7\)
6. A class of ten students get the following marks in a test: \(13,\ 23,\ 41,\ 55,\ 66,\ 78,\ 49,\ 33,\ 35,\ 67\). If anyone who scored less than one standard deviation below the mean fails how many students will fail?
2
Download this page: S9 Normal Distribution (PDF 254KB)
What's next... S10 Standard normal distribution