.
S6 Sample spaces
August 19, 2021 - 4:46pm — AJ (e67821)
A list or diagram showing all possible outcomes in a probability experiment is called a sample space. The probability that an event \(E\) occurs is
\[ Pr(E)=\frac{\textrm{number of ways $E$ can occur}}{\textrm{number of outcomes in the sample space}}=\frac{n(E)}{n(S)} \] assuming all outcomes are equally likely.
For tossing a single die the sample space is \(1,2,3,4,5,6\) and Pr(1) = Pr (2) = Pr(3) = Pr(4) = Pr(5) = Pr(6) = \(\dfrac{1}{6}\).

For the spinner below, which has 4 equal sectors, the sample space is Red, Green, Yellow, Blue and Pr(R) = Pr (G) = Pr(Y) = Pr(B) = \(\dfrac{1}{4}\).

Note: The sum of the probabilities of the distinct outcomes within a sample space is 1.
Tree Diagrams
A tree diagram can be used to find the sample space.
For example, if two coins are tossed there are four possible outcomes:
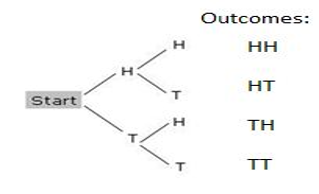
If H = Heads and T = Tails, the sample space for tossing two coins is HH HT TH TT
If \(E\) is the event “at least one head” then Pr(\(E)\) = Pr(HH or HT or TH) = \(\dfrac{1}{4}+\dfrac{1}{4}+\dfrac{1}{4}=\dfrac{3}{4}\)
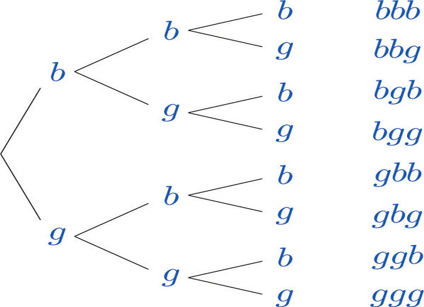
The sample space for a three child family is shown below:
If b = the child is a boy and g = the child is a girl, then if \(E\) is the event “first child a girl” , Pr(\(E)\) = \(\dfrac{4}{8}=\dfrac{1}{2}\).
Other Sample Spaces and Diagrams
Example 1
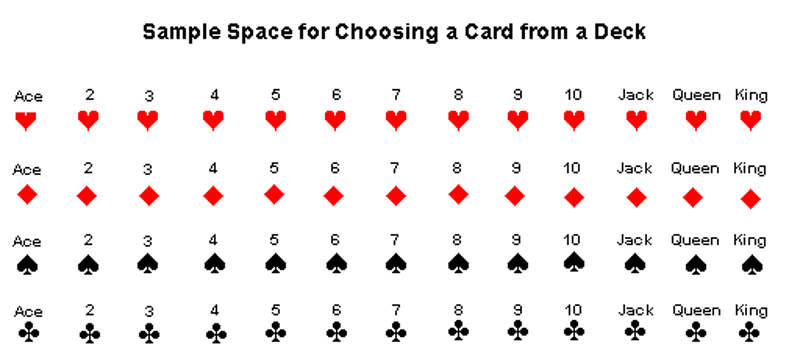
A standard deck of cards contains 52 cards. If a single card is drawn from the deck and \(D\) is the event “the card is a diamond” then Pr(\(D)\) = \(\dfrac{13}{52}=\dfrac{1}{4}\).
If a single card is drawn from the deck and \(E\) is the event: the card is a diamond (\(D\)) or an ace (\(A)\),
then \[\begin{align*} Pr(E) & =Pr(D\;or\;A)\\ & =Pr(D\cup A)\\ & =Pr(D)+Pr(A)-Pr(D\cap A)\\ & =\dfrac{13}{52}+\dfrac{4}{52}-\dfrac{1}{52}\\ & =\dfrac{16}{52}\\ & =\dfrac{4}{13}. \end{align*}\]
Example 2
Tables and Venn diagrams can also be used to organise information that makes finding probabilities easier.
The Venn diagram below shows the number of people in a survey who regularly ate KitKats (K), Mars Bars (M) or Rocky Road (R).
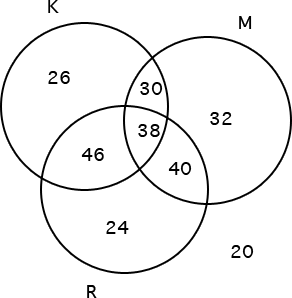
From the diagram we can see that there are 256 people.1 This is the sum of all the numbers on the diagram. Note that there are 20 people who do not eat any of these snacks. The number of people who eat KitKats is \[\begin{align*} 26+46+38+30 & =140. \end{align*}\]
\[\begin{align*} Pr(K) & =\frac{26+46+30+38}{256}\\ & =\frac{140}{256}\\ & =\frac{35}{64}.\\ \\ Pr(M\cap R) & =\frac{38+40}{256}\\ & =\frac{78}{256}\\ & =\frac{39}{128}\\ \\ Pr(\textrm{KitKat and Mars Bar but not Rocky Road}) & =Pr(K\cap M\cap R^{\prime})\\ & =\frac{30}{256}\\ & =\frac{15}{128}\\ \\ Pr(\textrm{at least one of these)} & =Pr(K\cup M\cup R)\\ & =1-Pr(K\cup M\cup R)^{\prime}\\ & =1-\frac{20}{256}\\ & =\frac{236}{256}\\ & =\frac{59}{64}. \end{align*}\]
Example 3
The table below shows the results of a study that looked at the association between smoking (S) and lung cancer (C).
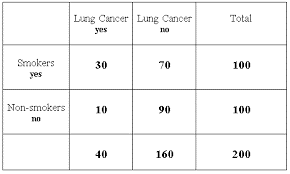
From the table we can see \[\begin{align*} Pr(S) & =\frac{100}{200}=\frac{1}{2}\\ \\ Pr(C^{\prime}) & =\frac{160}{200}=\frac{4}{5}\\ \\ Pr(S\cap C) & =\frac{30}{200}=\frac{3}{20} \end{align*}\]
Exercises
1. Use a tree diagram to find the sample space for a two child family. Hence find
the probability that both children are girls.
the probability that the oldest child is a girl.
the probability that at least one child is a girl.
\((a)\dfrac{1}{4}\quad\quad(b)\dfrac{1}{2}\quad\quad(c)\dfrac{3}{4}\)
2. The diagram shows the sample space for tossing a single die twice.

Find the probability that
the first toss is a 4
the sum of the two tosses is 5
at least one toss is a 6
neither toss is a 6
(a) \(\dfrac{1}{6}\quad\quad(b)\dfrac{1}{9}\quad\quad(c)\dfrac{11}{36}\quad\quad(d)\dfrac{25}{36}\)
3. In a classroom of 20 Yr 12 VCE students 10 study Maths Methods, 7 study Specialist maths and 5 study both. Organise the information in a Venn diagram and find the probability that a student chosen at random
studies neither of these maths subjects
studies Maths Methods but not Specialist Maths
\((a)\dfrac{2}{5}\quad\quad(b)\dfrac{1}{4}\)
4. Find the probability that a card drawn at random from a pack is
a red card
lower than a 5 (ace low)
\((a)\dfrac{1}{2}\quad\quad(b)\dfrac{4}{13}\)
Download this page: S6 Sample Spaces (PDF 288KB)
What's next... S7 Conditional probability