.
S3 Mean, mode, median
July 30, 2021 - 12:38pm — AJ (e67821)
The mean, mode and median are measures of the centre or middle of a set of data. They are sometimes called measures of central tendency and they provide a single value that is typical of the data.
Definitions
The mode is the value that occurs most often.
The median is the middle value when the data is arranged in order.
The mean (or average) is the sum of all the scores divided by the number of scores in the data set: \[ \overline{x}=\dfrac{\sum x_{i}}{n} \]
Example 1
Consider the data set \(3,2,0,5,2\). Find the mode, median and mean.
Solution:
The mode is \(2\) because it has the highest frequency (it occurs twice).
Rearranging the data in order gives \(0,2,\mathbf{\underline{2}},3,5\): the median is \(2\).
The mean is \[ \overline{x}=\dfrac{\sum x_{i}}{n}=\dfrac{3+2+0+5+2}{5}=2.4 \]
Example 2
Find the mean, mode and median of the data displayed in the frequency table.
| x | Frequency (f) |
|---|---|
| -3 | 1 |
| -1 | 3 |
| 4 | 1 |
| 5 | 2 |
| 24 | 1 |
| n = \(\sum\)f = 8 |
Solution:
The mode is \(-1\) (this score occurs most often - \(3\) times)
There are \(8\) scores and so two ‘middle’ scores, the 4th and 5th. Writing out the scores in order, we have \[\begin{align*} -3,\,-1,\,-1,\underbrace{-1,\,4,}_{\text{middle scores}}\,5,\,5,\,24 \end{align*}\] The median is the average of these two middle scores: \[\begin{align*} \text{median} & =\dfrac{-1+4}{2}\\ & =1.5. \end{align*}\]
The mean is1 Each score (\(x\)) is multiplied by its frequency (f), these values are then added and the result is divided by the total number of scores (\(n\)). \[ \dfrac{(-3)\times1+(-1)\times3+4\times1+5\times2+24\times1}{8}=4. \] Note that a disadvantage of the mean is that it is affected or distorted by extreme or outlying values.
Graphs and the Mode, Median and Mean
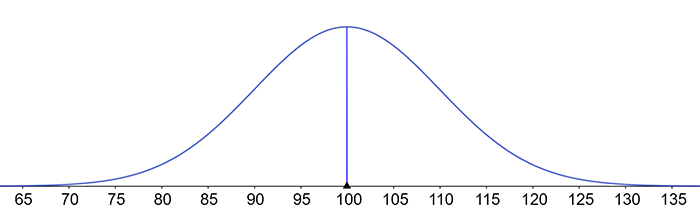
For symmetrical, bell-shaped distribution graphs such as shown above the mode, median and mean all have the same value, 100.
Stem and Leaf Plots
The data set \(1,\,1,\,2,\,7,\,11,\,13,\,13,\,14,\,18,\,20,\,22,\ldots,86,\,94,\,96\) is shown in the stem and leaf plot below
\[\begin{array}{ccccccccccc} & 0 & \mid & & 1 & 1 & 2 & 7\\ & 1 & \mid & & 1 & 3 & 3 & 4 & 8\\ & 2 & \mid & & 0 & 2 & 3 & 7 & 9\\ & 3 & \mid & & 2 & 3 & 4 & 5 & 5 & 5 & 8\\ & 4 & \mid & & 1 & 4 & 7 & 8 & 8 & 9 & 9\\ & 5 & \mid & & 0 & 2 & 4 & 5 & 7 & 8\\ & 6 & \mid & & 1 & 4 & 5 & 6 & 9\\ & 7 & \mid & & 4 & 7 & 8\\ & 8 & \mid & & 0 & 2 & 5 & 6\\ & 9 & \mid & & 4 & 6 \end{array}\]
Sometimes a stem and leaf plot will include an extra column with a cumulative count (counting from both ends) as shown below.
\[\begin{array}{ccccccccccccc} \mathit{4} & & \mid & 0 & \mid & & 1 & 1 & 2 & 7\\ \mathit{9} & & \mid & 1 & \mid & & 1 & 3 & 3 & 4 & 8\\ \mathit{14} & & \mid & 2 & \mid & & 0 & 2 & 3 & 7 & 9\\ \mathit{21} & & \mid & 3 & \mid & & 2 & 3 & 4 & 5 & 5 & 5 & 8\\ & & \mid & 4 & \mid & & 1 & 4 & 7 & 8 & 8 & 9 & 9\\ \mathit{20} & & \mid & 5 & \mid & & 0 & 2 & 4 & 5 & 7 & 8\\ \mathit{14} & & \mid & 6 & \mid & & 1 & 4 & 5 & 6 & 9\\ \mathit{9} & & \mid & 7 & \mid & & 4 & 7 & 8\\ \mathit{6} & & \mid & 8 & \mid & & 0 & 2 & 5 & 6\\ \mathit{2} & & \mid & 9 & \mid & & 4 & 6 \end{array}\]
A scan of the data organised into the plot reveals that the mode is 35 (it occurs three times).
There are 21 scores less than or equal to 38 and 20 scores greater than or equal to 50 . There are also 7 scores in the forties. So altogether there are 48 scores. The median will be midway between the 24th and 25th scores which are easy to locate when we know the 21st score is 38. The median is 47.5 (midway between 47 and 48).
Exercise 1
Given the following scores: 12, 12, 13, 14, 14, 15, 15, 15, 16.
Find the mean score
Find the median
What is the mode?
- \(14\quad\)b. \(14\quad\) c. \(15\)
Exercise 2
Determine the mean, mode and median for the data in the frequency table
| Score | Frequency |
|---|---|
| 40 | 1 |
| 50 | 4 |
| 60 | 8 |
| 70 | 3 |
| 80 | 3 |
| 90 | 1 |
mean = \(63\), mode = \(60\), median = \(60.\)
Exercise 3
Find the mode and median for the data displayed in the stem and leaf plot for which the smallest score is 10 and the largest 69.
\[\begin{array}{ccccccccccc} 1 & & \mid & & 0 & 7 & 9\\ 2 & & \mid & & 1 & 1 & 3 & 4 & 6 & 7 & 8\\ 3 & & \mid & & 0 & 1 & 3 & 5 & 6 & 7 & 7\\ 4 & & \mid & & 0 & 1 & 1 & 1 & 2\\ 5 & & \mid\\ 6 & & \mid & & 9 \end{array}\]
mode = \(41\), median = \(31\).
Download this page, S3 Mean, mode, median (PDF 184KB)
What's next... S4 Measures of spread