.
S2 Data
July 30, 2021 - 12:40pm — AJ (e67821)
Definitions
\(\mathbf{Population}\): the total group of individuals or items under consideration.
\(\mathbf{Sample}\): a group of individuals or items chosen from the population.
\(\mathbf{Data}\): the information collected from the sample or population.
\(\mathbf{Statistic}\): a number calculated from the sample data.
\(\mathbf{Parameter}\): a number calculated from the population data.
Types of data
Data may be either qualitative (categorical) or quantitative (numerical)
\(\mathbf{Qualitative\,Data}\) (classified or labeled).
Data is put into non-numerical categories. Blood type, religion, cause of death, are all examples of qualitative data.
\(\mathbf{Quantitative\,Data}\) (counted or measured).
There are two types of quantitative data.
\(\mathit{Discrete\,Data:}\) data is put into categories depending on its counted number; for example, the number of children in a family.
\(\mathit{Continuous\,Data:}\) data is put into categories depending on its measured size; for example, height.
Graphical Representation of Data
Qualitative/Categorical data is often represented by means of a bar chart or a pie chart.
Quantitative/Numerical Data is often represented by means of a frequency bar chart called a histogram.
Examples
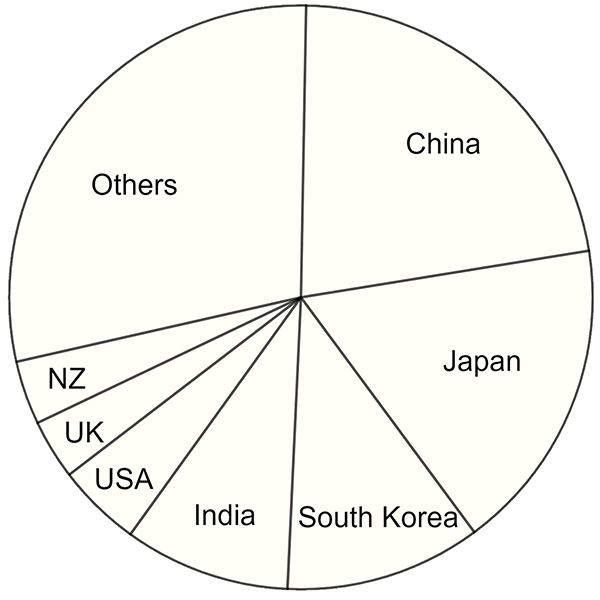
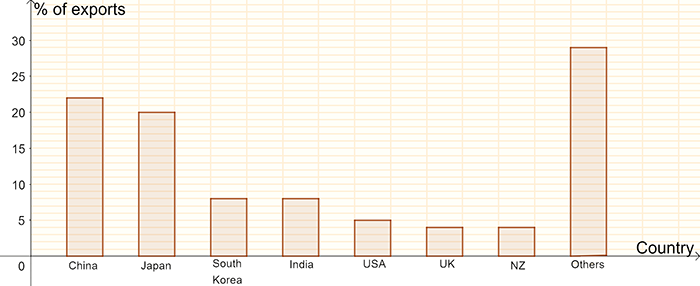
- The table shows the percentage of Australian imports from various countries. This data can be represented on a pie chart so that comparisons are easier.
| Country | Imports % |
|---|---|
| China | 22 |
| Japan | 20 |
| South Korea | 8 |
| India | 8 |
| USA | 5 |
| UK | 4 |
| New Zealand | 4 |
| Others | 29 |
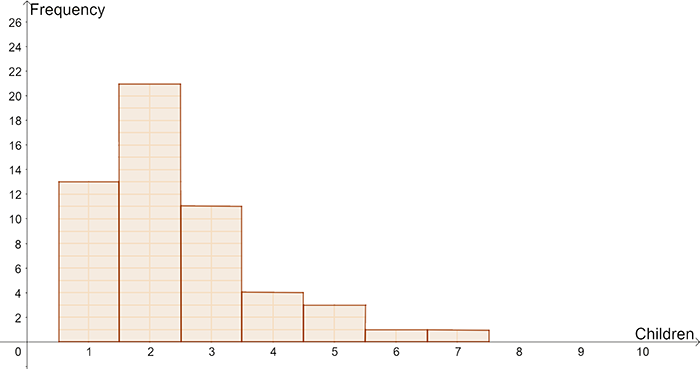
- A group of school students were surveyed to find the number of children in their families. This data can be represented using a histogram.
| No. of Children | Frequency |
|---|---|
| 1 | 13 |
| 2 | 21 |
| 3 | 11 |
| 4 | 4 |
| 5 | 3 |
| 6 | 1 |
| 7 | 1 |
| Total | 54 |
Exercise 1
Label each of the following as either a categorical or numerical variable. For the numerical variables label each as either discrete or continuous.
Hair colour
A persons religion
A persons height
Number of children in a family
The weights of babies born on a particular day
The number of crimes committed in Victoria each week
The distance traveled to work by the employees of a large company
The make of car driven by students at RMIT
Categorical
Categorical
Numerical – continuous
Numerical – discrete
Numerical – continuous
Numerical – discrete
Numerical – continuous
Categorical
Exercise 3
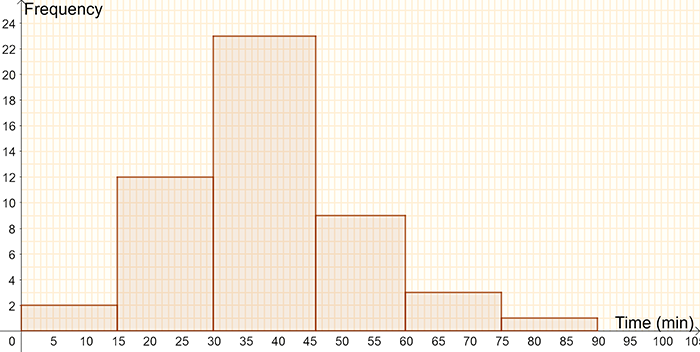
A group of employees recorded the time that it took them to travel to work on a particular day (see table below). Represent this data using a histogram.
| \(\mathbf{Time\:in\:minutes}\) | \(\mathbf{Frequency}\) |
|---|---|
| 0 - < 15 | 2 |
| 15 - < 30 | 12 |
| 30 - < 45 | 23 |
| 45 - < 60 | 9 |
| 60 - < 75 | 3 |
| 75 - < 90 | 1 |
| \(\mathbf{Total}\) | \(\mathbf{50}\) |
Download this page, S2 Data (PDF 703KB)
What's next... S3 Mean, mode, median