.
S16 P-value
September 16, 2021 - 12:34pm — AJ (e67821)
In hypothesis testing two approaches are possible when making the decision as to whether to reject the null hypothesis. So far we have compared the test statistic with the critical value(s) and asked the question:
Is the test statistic more extreme than the critical value? Yes \(\Rightarrow\) Reject \(H_{o}\) and No \(\Rightarrow\) Do not reject \(H_{o}\).
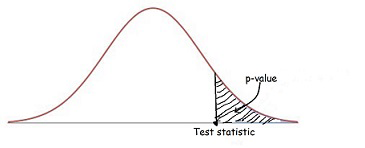
An alternative approach involves calculating the p-value and comparing it with \(\alpha\). The p-value is a probability. It is a measure of the likelihood of the test statistic being obtained if the null hypothesis is true. If that probability is low enough we reject the null hypothesis. How low is low enough? This is the value \(\alpha\) and it is set before we calculate the test statistic. Our question becomes:
“Is p < \(\alpha\)?” Yes \(\Rightarrow\) Reject \(H_{o}\) and No \(\Rightarrow\) Do not reject \(H_{o}\).
Calculation of the p-value
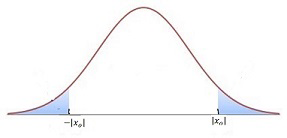
For a \(2\)-sided test, where \(x_{o}\) is the test statistic, the p-value is the sum of the areas of the two regions beyond \(-\left|x_{o}\right|\) and \(\left|x_{o}\right|\) as shown below.
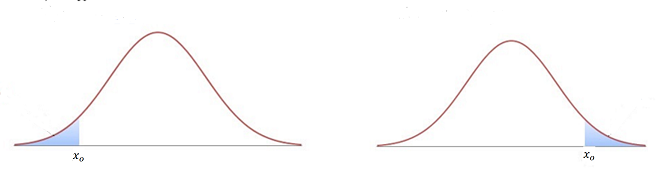
For a \(1\)-sided test, where \(x_{o}\) is the test statistic, the p-value is either the area to the left of \(x_{o}\) for a left handed test, or the area to the right of \(x_{o}\) for a right sided test as shown below.
The six steps to conduct a hypothesis test then become:
State the null and alternative hypotheses
Choose the level of significance, \(\alpha\)
Calculate the test statistic
Compute the p-value of the test statistic
Decide whether to reject the null hypothesis by comparing the p-value to \(\alpha\)
State your conclusion in words.
Example
The student queries service at a university claim that during orientation week the average wait time to be seen is \(23\) minutes., However this has been disputed as feedback from student focus groups indicates the wait is much longer. To test the hypothesis, the wait time for \(40\) randomly selected students is recorded during the next orientation week., The average wait time is found to be \(25\) minutes with a standard deviation of \(5\) minutes., Is there evidence to support the hypothesis that the average wait time exceeds \(23\) minutes at a \(5\)% level of significance?
Hypotheses:
\(H_{o}:\mu=23\)
\(H_{a}:\mu>23\)Significance level
\(\alpha=0.05\).Test statistic1 We are using a t-test because the population standard deviation is unknown.
\(t=\frac{\overline{x}-\mu}{s_{\overline{x}}}\)= \(\frac{25-23}{\frac{5}{\sqrt{40}}}\) = 2.53.P-value
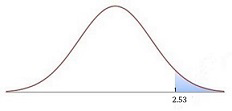
The area to the right of \(2.53\) is \(0.00778\). 2 You must use technology (graphics calculator or an online tool such as Stat Trek) rather than tables to calculate the p-values for a \(t\) distribution
Decision
Is \(0.0078<0.05\)? Yes, therefore we reject \(H_{o}\).Conclusion
There is evidence to suggest that the average waiting time for student queries during orientation week is more than 23 minutes.
Exercise
Your answers should be set out and contain all the steps required by your course. A brief outline of the main features is given in the answers below.
A sample of \(10\) is drawn from a normally distributed population and the mean is found to be \(37.22\). Use the p-value method to see if the sample mean is significantly less than the population mean of \(40\) if the population standard deviation is known to be \(3.27\) (use \(\alpha=0.05\)).
Test statistic \(z=-2.69,\ p=0.0037.\) Reject \(H_{o}\).
It is believed that traditionally \(35\)% of RMIT students are aware of the SLC Maths Drop-in service. Management have recently implemented a new marketing program and results of a new survey show that out of the\(100\) randomly sampled students \(42\) knew of the service. Is there evidence to suggest that the proportion of students at RMIT who are aware of the Maths Drop-in service has changed after the implementation of the marketing initiative? Use \(\alpha=0.1\) with the p-value method.
Test statistic \(z=\pm1.47,\ p=0.142.\) Do not reject \(H_{o}\).
The manufacturer of ‘branbix’ cereal claims the mean weight of contents of each box is \(450g\). A consumer interest magazine weighs a sample of \(100\) boxes and finds that they have a mean of \(444g\) with a standard deviation of \(28g\). Use the p-value method to decide whether the sample data contradict the manufacturers and the boxes are being under filled? (use \(\alpha=0.01\))
Test statistic \(t=-2.14,\ p=0.017.\) Do not reject \(H_{o}\).
Download this page: S16 P-values (PDF 155KB)
What's next... S17 One sided tests