.
S15 T-tests
September 16, 2021 - 12:34pm — AJ (e67821)

Image by Pixabay
T-distribution
In conducting a hypothesis test the population standard deviation \(\sigma\) may be unknown. In that case we approximate with the sample standard deviation \(s\) when calculating the standard error of the distribution of means.
\[ s_{\overline{x}}\approx\sigma_{\overline{x}}\,\textrm{ or }\frac{s}{\sqrt{n}}\approx\frac{\sigma}{\sqrt{n}}. \]
A sampling distribution that results from approximating \(\sigma\) with \(s\) is called a t-distribution. However, \(\sigma\) is a fixed value and \(s\) varies with each sample. This creates a level of uncertainty that slightly distorts the shape of the distribution of sample means. The resulting curve is close to a normal distribution when \(n\) is large, but for small \(n\) it has heavier tails.
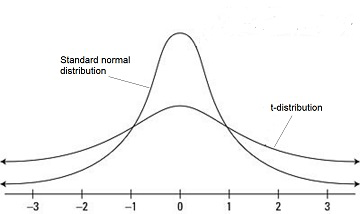
The precise shape of the t-distribution depends on the size of the sample. A t-distribution is always bell shaped but the shape of the curve varies according to the size of the sample. As the sample size increases, a t-distribution becomes more like the z-distribution.
T-tests
A t-test is a hypothesis test which like the z-test is used to make decisions about the similarity of sample and population means. The test statistic is \[ t=\frac{\overline{x}-\mu}{\frac{s}{\sqrt{n}}} \]
Like a z-test it is assumed that the sample data is drawn randomly and that the distribution of sample means follows a normal distribution.
Many students are confused about whether to use a z-test or a t-test to test their hypothesis.
Generally,
if \(\sigma\) is known, then a z-test is appropriate
if \(\sigma\) is not known, then a t-test is appropriate.
However,
- Many text books only provide t-tables for \(n\leq30\). For larger samples the z-distribution is a reasonable approximation and a z-test may be used even though \(\sigma\) is unknown.
- Some courses provide students with more comprehensive t-tables for \(n\) up to \(50\) or \(100\). If you have access to relevant tables you should use a t-test whenever \(\sigma\) is not known regardless of the size of the sample.
- If \(s\) is known to be a good approximation for \(\sigma\) then a z-test may be appropriate.
- If a computer package such as SPSS, Minitab or EXCEL is being used for the hypothesis test then a t-test should be selected when \(\sigma\) is unknown.
The conventions differ between courses so check what is appropriate for your subject
Steps in a t-test
State the hypotheses
\(H_{o}:\) \(\mu_{\overline{x}}=\mu\) (the sample mean is the same as the population mean after allowing for chance variation)
\(H_{o}:\mu_{\overline{x}}\neq\mu\) (the sample mean is not the same as the population mean after allowing for chance variation)Significance level \(\alpha\) is chosen (\(\alpha=0.05\Rightarrow\) we are defining reasonable as what we can expect 95% of the time)
Critical values
Tables or a calculator or a computer are used to find the t-value that corresponds to the chosen significance level. These are called the critical values and depend on the degrees of freedom \((n-1\)) and \(\alpha\).The test statistic is the standardised difference between the sample mean (calculated from the given data) and the known population mean: \(t=\frac{\overline{x}-\mu}{\frac{s}{\sqrt{n}}}\)
Decision: Is the result reasonable if \(H_{o}\) is true?
Is the test statistic more extreme than the critical value?
Yes \(\Rightarrow\) Reject \(H_{o},\) No \(\Rightarrow\) Do not reject \(H_{o}\)Conclusion
There is (if you reject)/is not (if you do not reject) evidence to suggest that…
It is important to note that
- The decision about the null hypothesis is not made with certainty but with a level of confidence that the error in the decision is small (for example 5% if \(\alpha=0.05\))
- The decision relates only to rejecting or not rejecting \(H_{o}\). \(H_{a}\) is not mentioned in the decision, and we DO NOT accept \(H_{o}\) or \(H_{a}\).
- The steps for hypothesis testing may differ from course to course so check with your program.
Example
A manufacturer of batteries claims that on average a battery lasts \(200\) hours. To test this claim \(7\) batteries are randomly selected and this sample has an average of only \(190\) hours with a standard deviation of \(9\) hours. Does this sample provide evidence at the \(1\)% level of significance that the manufacturers claim is incorrect?
State the hypotheses
\(H_{o}:\) \(\mu_{\overline{x}}=200\) (the sample mean is the same as the population mean)
\(H_{o}:\mu_{\overline{x}}\neq200\) (the sample mean is not the same as the population mean)Significance level \(\alpha=0.01\)
Critical values
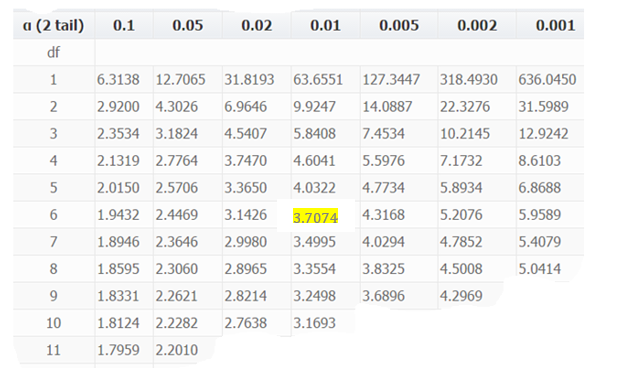
\(\alpha=0.01\) indicates the column and degrees of freedom\(=n-1=6\) indicates the row

Test statistic
\(t=\frac{\overline{x}-\mu}{\frac{s}{\sqrt{n}}}\)=\(\frac{190-200}{\frac{9}{\sqrt{7}}}=-2.94\)Decision:
Is -2.94 more extreme than \(-3.7074?\) No \(\Rightarrow\)Do not reject \(H_{o}\)Conclusion
There is not evidence to suggest that the average battery life differs from 200 hours.
Exercises
Your answers should be set out and contain all the steps shown above. A brief outline of the main features is given in the answers below.
1. The number of nic nac lollies in a small pack follows a normal distribution and the average is claimed to be \(40\). A suspicious customer buys \(10\) packs and counts the nic nacs in each pack. The results are: 38 45 36 40 42 44 35 41 36 40. Use a one sided test with \(\alpha\) \(=0.05\) to decide whether the customer’s are justified.
Answer: Test statistic = \(-0.28\) do not reject \(H_{o}\).
2. A hospital claims a new process will reduce the waiting time for surgery to treat a condition considered as non life threatening. To date the average waiting time has been \(15.7\) months. A random sample of \(33\) patients diagnosed with the condition were observed and the time till surgery recorded (\(\overline{x}=13.664,s=2.544\)). Test the hospitals claim at the \(1\)% significance level.
Answer: Test statistic = \(-0.28\) do not reject \(H_{o}\).
3. The quality of a pre-natal program for at-risk mothers is to be assessed by comparing the weight of babies born to mothers participating in the program with the historical average of \(2800g\). The babies of the \(25\) mothers in the program had a mean birth weight of \(3075g\) and a standard deviation of \(300\) \(g\). Comment on success of the program using a two sided hypothesis test and \(\alpha=0.01\).
Answer: Test statistic = \(4.58\) reject \(H_{o}\)
Download this page: S15 T-Test (PDF 1.907KB)
What's next... S16 P-value