.
S11 Probability and the normal distribution
September 16, 2021 - 12:32pm — AJ (e67821)
Even when data follows a normal distribution, different data sets will have their own mean and standard deviation and a different bell shaped curve as illustrated below.
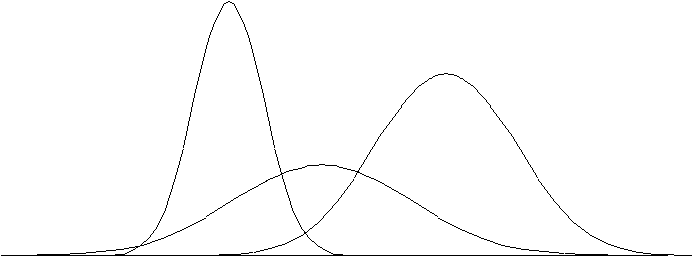
But every score in a normally distributed data set, regardless of the shape, has an equivalent score in the standard distribution. The mean of a normal distribution corresponds to a standardised score of \(0\) and we can see that \(\mu\pm\sigma\rightarrow\pm1\), \(\mu\pm2\sigma\rightarrow\pm2\) and \(\mu\pm3\sigma\rightarrow\pm3\).
\(z-\)Scores
For other values of the mean and standard deviation, we can use the formula \[\begin{align*} z & =\frac{x-\mu}{\sigma} \end{align*}\] to find \(z\) scores (where the \(z\) score is the number of standard deviations away from the mean).
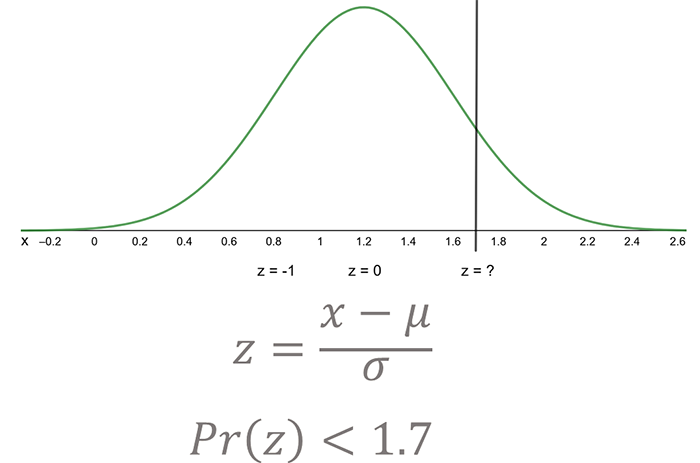
For example, if we have a Normal Distribution with a mean of \(1.2\) and a standard deviation of \(0.4\), then to find the standardised score for \(x=1.7\):
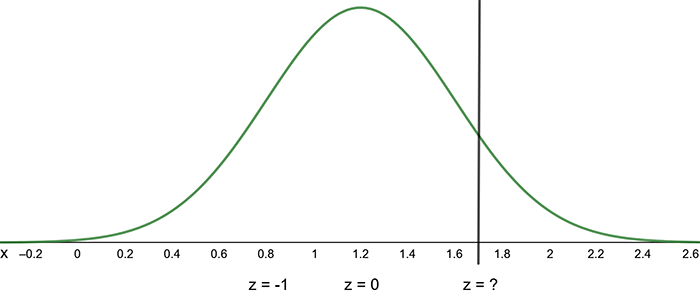
\[\begin{align*} z & =\frac{(x-\mu)}{\sigma}\\ & =\frac{(1.7-1.2)}{0.4}\\ & =1.25 \end{align*}\]
A score of \(1.7\) in the distribution with mean \(1.2\) and standard deviation \(0.4\) is equivalent to a standardised score of \(1.25\). Alternatively, we could say that the score \(1.7\) is \(1.25\) standard deviations above the mean for that distribution.
Calculating Probabilities Using \(z-\)Scores
Once we have converted the scores of our distribution into standard scores or \(z\)-scores we can use normal distribution tables to calculate precise percentages and probabilities.
The normal distribution is a continuous distribution, so we can find the probability that \(x\) is greater than or less than a particular value, but not that \(x\) is equal to a particular value.
Because the total area under the standardised curve is \(1\), \(\Pr\left(z<\beta\right)\) is equivalent to the area to the left of \(\beta.\)

Example 1
If the mean maximum temperature for Melbourne in January is \(25.9^{\circ}\)C with a standard deviation of \(2.1^{\circ}\) what is the probability that the mean maximum temperature for January \(2015\) will be above \(28^{\circ}\)C?
First draw a diagram.
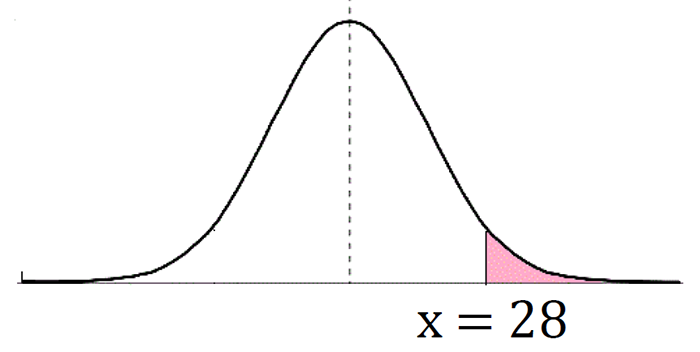
\[\begin{align*} x & =28\\ z & =\frac{(x-\mu)}{\sigma}\\ & =\frac{(28-25.9)}{2.1}\\ & =1.\\ \Pr\left(x>28\right) & =\Pr\left(z>1\right)\\ & =1-\Pr\left(z<1\right)\\ & =1-0.8413\ \ \left(0.8413\textrm{ is from the table at end of this module}\right)\\ & =0.1587. \end{align*}\] That is, the probability that the mean maximum temperature for January \(2015\) will be above \(28^{\circ}\)C is \(0.1587.\)
Example 2
The top \(0.5\)% of students applying for Stato university are given full scholarships. If the mean score on the entrance exam is \(372\) and the standard deviation is \(40\), what mark is needed to obtain a scholarship?
First draw a diagram.

The area to the right of \(x_{s}=0.005\).1 We want to find \(x_{s}\).
We know that \(\Pr\left(x>x_{s}\right)=0.005\) but we must first find the \(z\)- score corresponding to this. Let’s call it \(z_{s}.\) Then \[\begin{align*} \Pr\left(z>z_{s}\right) & =0.005 \end{align*}\] and \[\begin{align*} \Pr\left(z<z_{s}\right) & =1-0.005\\ & =0.9950. \end{align*}\] Using the table at the end of this module, we look up \(0.995\) in the body of the table and see that the corresponding \(z\)- score is \(z_{s}=2.57\) or \(z_{s}=2.58\). We will take \(z_{s}=2.58.\)2 You could take the average of \(2.57\) and \(2.58\) in this case, that is \(2.575\) but two decimal places of accuracy is usually enough. Now using the formula we have \[\begin{align*} z_{s} & =\frac{x_{s}-\mu}{\sigma}\\ 2.58 & =\frac{x_{s}-372}{40}.\\ \textrm{Rearranging we have, }x_{s} & =2.58\times40+372\\ & =475.2\,. \end{align*}\] So applicants who score more than \(475.2\) will get a scholarship.
Exercises
1. If a population has a mean I.Q. of \(100\) and a standard deviation of \(15\), find:
the probability that an individual chosen at random will have an I.Q. between \(110\) and \(130\).
the probability that an individual chosen at random will have an I.Q. greater than \(87\).
(a) \(0.2297\quad\)(b) \(0.8069\)
2. A coffee machine is regulated to deliver \(200\,mL\) per cup. In fact, the amount of coffee varies, following a normal distribution with a mean of \(200\,mL\) and a standard deviation of \(10\,mL\).
What is the probability that a cup contain less than \(195\,mL\)?
What is the probability that a cup will contain more than \(220\,mL\)?
What is the probability of a cup containing between \(195\) and \(215\,mL\)?
(a) \(0.3085\quad\)(b) \(0.0228\quad\)(c) \(0.6247\)
3. The heights of a group of men follow a normal distribution with a mean of \(180\,cm\) and a standard deviation of \(6\,cm\).
What is the probability that a man chosen from this group is less than \(185\,cm\) tall?
If the tallest \(10\%\) of this group are automatically eligible for a basketball team, what is the qualifying height?
(a) \(0.7977\quad\)(b) \(187.69\,cm\)
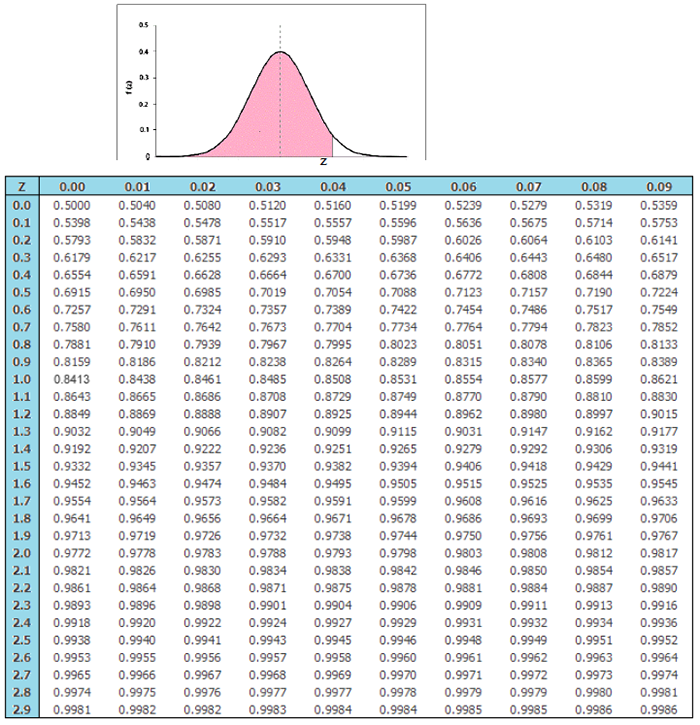
Table for Calculating z-Values
The table below gives the probability (the shaded area to the left) for a particular \(z\)-value.
Download this page: S11 Probability and Normal Distribution (PDF 704KB)
What's next... S12 Sampling distributions