.
S10 Standard normal distribution
September 16, 2021 - 12:31pm — AJ (e67821)
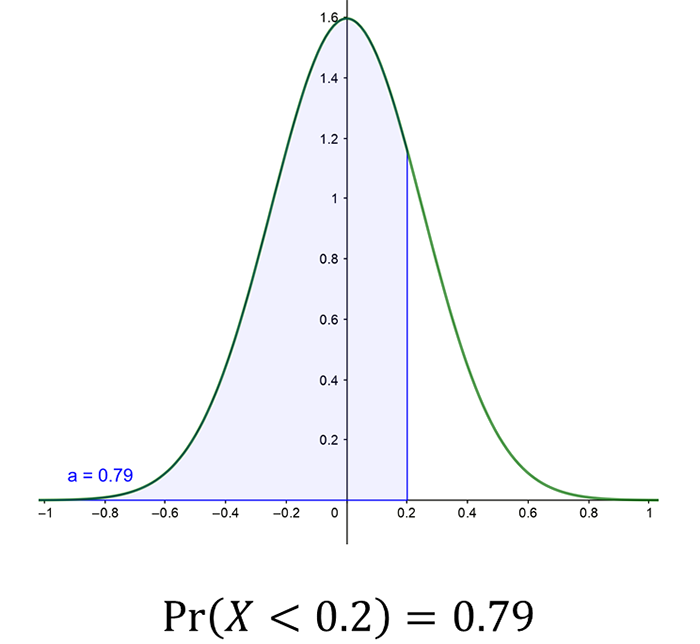
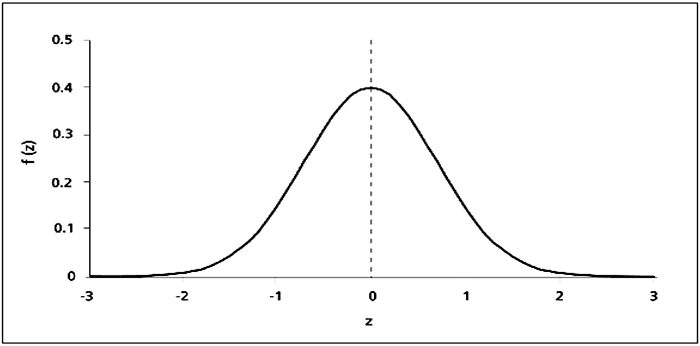
The standard normal distribution (sometimes called a z-distribution) has a mean of zero (\(\mu=0\)) and a standard deviation of \(1\ (\sigma=1)\).
Tables and Probabilities
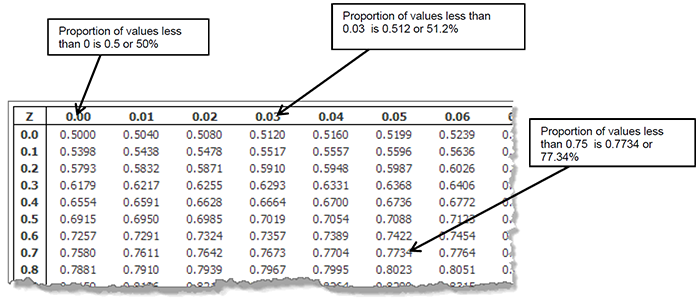
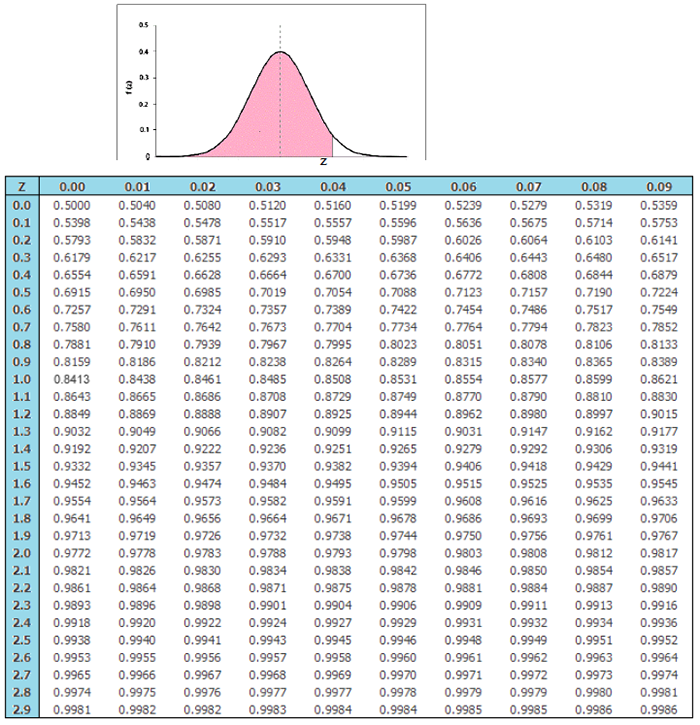
If we are working with the standard normal distribution we are not restricted to the 68-95-99 rule because tables are available to enable us to find proportions or percentages or probabilities for any value in the distribution. Tables come in different layouts, but this table (a portion of the table is shown below) gives the proportion to the left of a chosen z-value of up to 2 decimal places.
We can interpret our proportions or percentages as probabilities:
\(\Pr\left(z<0.00\right)=0.500\) or \(50\)%.1 This corresponds to the number in line with \(0.0\) in the left hand column and \(0.00\) in the top row of the table.
\(\Pr\left(z<0.03\right)=0.512\) or \(51.2\)%.2 This corresponds to the number \(0.0\) in the left hand column and \(0.03\) in the top row of the table.
\(\Pr\left(z<0.75\right)=0.7734\) or \(51.2\)%.3 This corresponds to the number in line with \(0.7\) in the left hand column and \(0.05\) in the top row of the table.
Note that a graphics calculator or a computer can also be used to find areas, proportions and probabilities in a normal distribution, rather than the table used here.
Example 1:
In a standard normal distribution what percentage of values will be less than 1.28?
Solution:
Draw a diagram as follows.
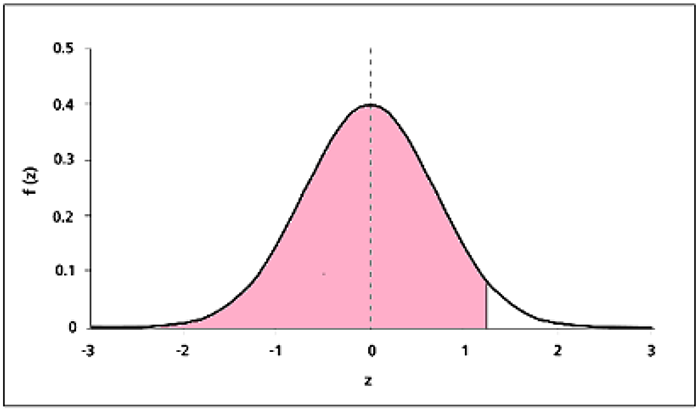
We are looking for the shaded area to the left of \(z=1.28.\) Using the following table we find that the area to the left is \(0.8997\).
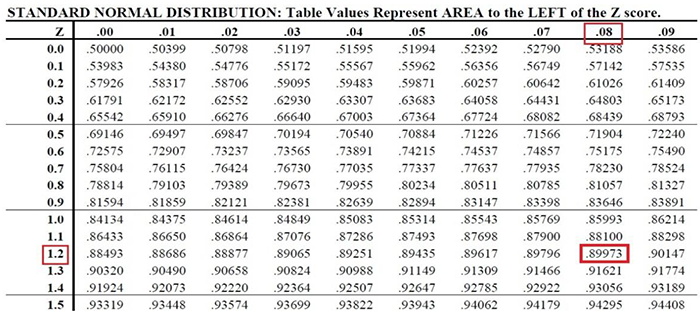
So the percentage is \(89.97\)%.
Example 2:
In a standard normal distribution what percentage of values will be more than 1.28?
Solution:
We want to find the percentage area shown below.
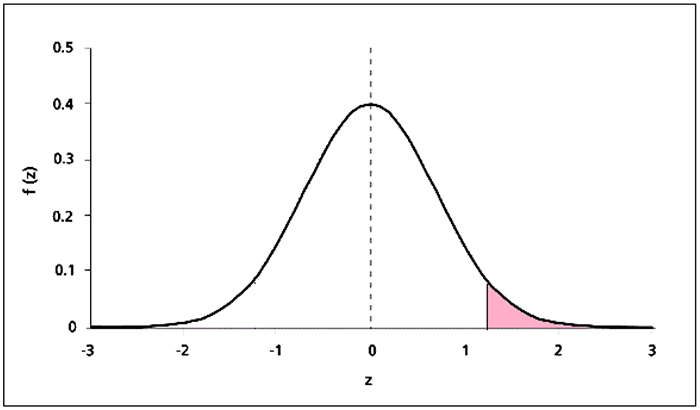
We cannot read areas to the right of a z-value directly from the table at the end of this module. Instead we observe that: 100% of all values lie under the curve. The area to the left of the shaded region is the same as part a). So the percentage of values to the right of \(1.28\) will be \(100\)% minus the percentage to the left of \(1.28\). Therefore the percentage of values more than \(1.28\) is \(100\)%\(-\) \(89.97\)% = \(10.03\)%.
Example 3:
In a standard normal distribution what percentage of values will be between \(0\) and \(1.28\)?
Solution:
We want to find the percentage area shown below.
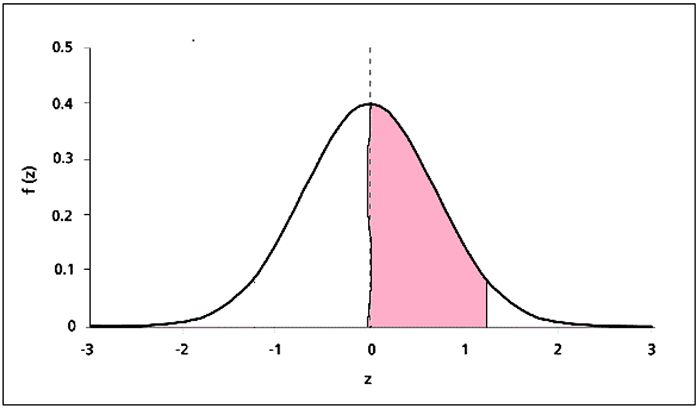
We cannot look up areas between two values directly from the table. But we know from Example 1 that 89.97% of values are less than 1.28. We also know \(50\)% of values lie to the left of the mean \(\left(z=0\right)\) because this is a property of our symmetrical bell curve. Therefore the percentage of values between \(0\) and 1.28 is \(89.97\)% \(-\) \(50\)% = \(39.97\)%.
Example 4:
In a standard normal distribution what percentage of values will be greater than \(-1.28\)?
Solution:
We want to find the percentage area shown below.
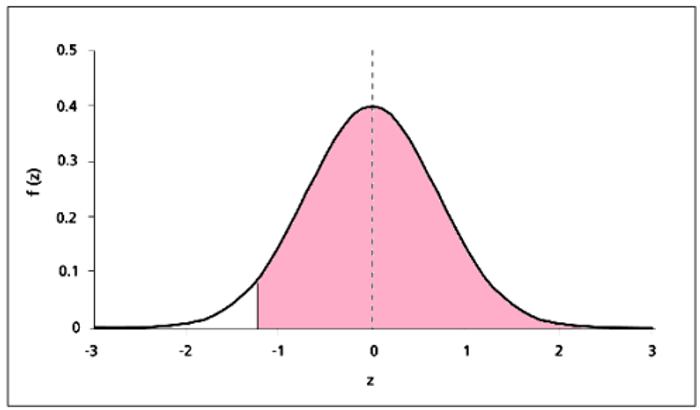
We cannot usually look up negative values in the table.4 There are some normal distribution tables that include negative z values. But we know that the bell curve is symmetrical as shown below:
The area to the right of \(-1.28\) is the same as the area to the left of \(1.28\). Therefore the percentage of values greater than \(-1.28\) is \(89.97\)% from Example 1.
Example 5:
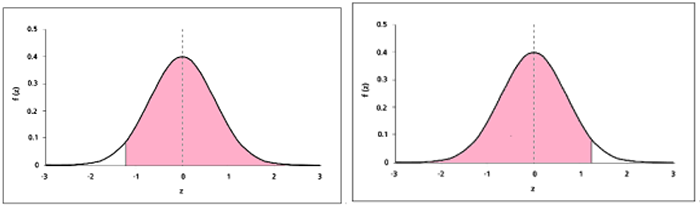
In a standard normal distribution what percentage of values will be between \(-1.28\) and \(1.28\)?
Solution:
To find this area we use the symmetry of the graph.
Observe that the area between \(-1.28\) and \(0\) is exactly the same as the area between \(0\) and \(1.28\).
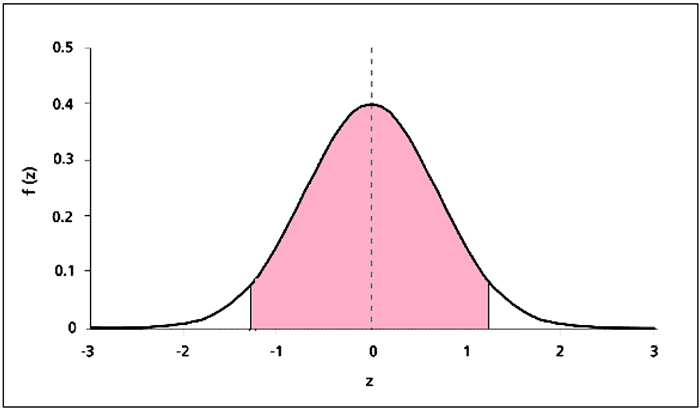
To find this area we use the symmetry of the graph.
Observe that the area between \(-1.28\) and \(0\) is exactly the same as the area between \(0\) and \(1.28\).
We know the area between \(0\) and \(1.28=39.97\)% because we found it in Example 3 above.
Therefore the percentage of the graph between \(-1.28\) and \(1.28\) is \(2\times39.97\)% \(=79.8\)%.
Exercises
- In a standard normal distribution what percentage of values will be
\(\quad\)(a) less than \(1.95\)?
\(\quad\)(b) less than \(-1.95\)?
\(\quad\)(c)between \(-1.95\) and \(0\)?
\(\quad\)(d) greater than \(1.95\)?
\(\quad\)(e) between \(-1.95\) and \(1.95.\)
Note that answers may vary slightly depending on whether tables or calculators are used.
(a) \(97.44\%%\ \quad\) \(\ \)(b) \(2.56\%\ %\quad\quad\) \(\ \)(c) \(47.44\%%\ \quad\quad\) \(\ \)(d) \(2.56%\%\ \quad\quad\) \(\ \)(e) 94.88%
- In a standard normal distribution what proportion of values lie between \(-0.5\) and \(1.5\)?
\(0.6247\)
- In a standard normal distribution what proportion of values lie outside the interval \(\pm1.7\)?
\(0.0892\)
- Given that a value in a standard normal distribution is greater than -1 what is the probability that it will be less than 2? (Hint: use the conditional probability formula.)
\(0.9729\)
Table
The proportion of the area under the curve to the left of a chosen value of z is given in the table below.
Download this page: S10 Standard Normal Distribution (PDF 1.907KB)
What's next... S11 Probability and the normal distribution