.
D9 Curve sketching
February 2, 2023 - 3:10pm — AJ (e67821)
If you find some key points of a function such as: maxima, minima, or turning points; x and y axis intercepts; and regions where the gradient is positive or negative, you can put together a sketch of a curve. Read this section to find examples of this being done.
To sketch a curve it is helpful to find the
\(x\) and \(y\) intercepts
Maximum and minimum points.
This module describes how to do this.
Definition of Maximum and Minimum
A stationary point is a point on a graph of a function \(y=f\left(x\right)\) where the tangent to the curve is horizontal. At a stationary point the derivative function \(y=f'\left(x\right)=0.\)
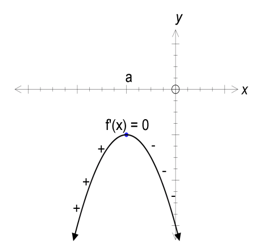
A maximum stationary point occurs at \(x=a\) if \(f'\left(a\right)=0\) and \(f'\left(x\right)>0\) for \(x<a\) and \(f'\left(x\right)<0\) for \(x>a\) as shown below.
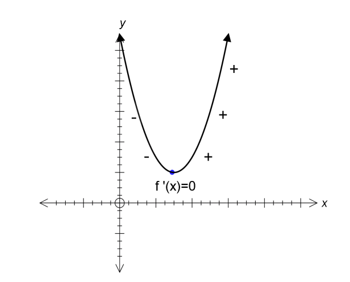
A minimum stationary point occurs at \(x=a\) if \(f'\left(a\right)=0\) and \(f'\left(x\right)\)< 0 for \(x<a\) and \(f'\left(x\right)\)> 0 for \(x>a\) as shown below.
Example 1
Find the turning point of the parabola defined by \(y=x^{2}+4x+5\) and determine if it is a maximum or minimum.
Solution
Let
\[\begin{align*} f\left(x\right)=x^{2}+4x+5 \end{align*}\] then \[\begin{align*} f'\left(x\right) & =2x+4. \end{align*}\] At a stationary point, \(f'\left(x\right)=0,\) so \[\begin{align*} 2x+4 & =0\\ 2x & =-4\\ x & =-2 \end{align*}\] is the \(x-\)coordinate of a stationary point. When \(x=-2,\) \[\begin{align*} f\left(-2\right) & =(-2)^{2}+4(-2)+5\\ & =1. \end{align*}\] Hence the coordinates of the stationary point are \(\left(-2,1\right).\) Now we ascertain if it is a maximum or minimum.
A sign test can be used to determine whether the stationary point is minimum or a maximum by checking the slope of the tangent on each side of the stationary point. Consider the table below.
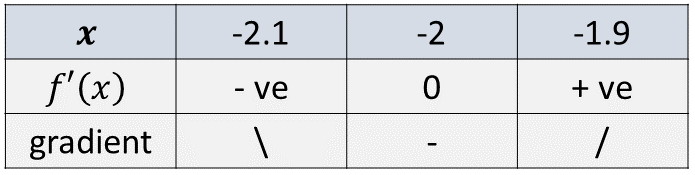
As we move from the left to the right of the stationary point at \(x=-2\), the gradient changes from negative to positive. This indicates there is a minimum at \(\left(-2,1\right)\).
Hence the turning point of the parabola is a minimum and occurs at \(\left(-2,1\right)\).
Example 2
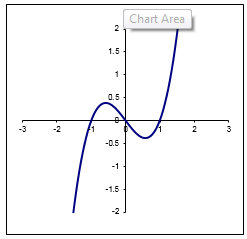
Sketch the graph of \(y=x^{3}-x.\)
Solution strategy:
Find intercepts on \(x-\)axis.
Find stationary points.
Establish if stationary points are maximum or minimum values.
Plot intercepts and stationary points and sketch the graph.
Solution
For \(x-\)axis intercepts, we set \(y=0,\) so \[\begin{align*} 0 & =x^{3}-x\\ & =x\left(x^{2}-1\right). \end{align*}\] Consequently, \(x=0\) or \[\begin{align*} x^{2}-1 & =0\\ x & =1\text{ or $-1.$ } \end{align*}\] Hence the \(x-\)axis intercepts are \(\left(-1,0\right),\ \left(0,0\right)\ \text{and $\left(1,0\right)$ .}\)
For stationary points, \[\begin{align*} \frac{dy}{dx} & =0 \end{align*}\] that is \[\begin{align*} 3x^{2}-1 & =0\\ x^{2} & =\frac{1}{3}\\ x & =\pm\frac{1}{\sqrt{3}}\\ & \approx\pm0.58. \end{align*}\]
Substituting these \(x\) values back in \(y=x-x^{3}\) gives for \(x=1/\sqrt{3}\), \[\begin{align*} y & =\left(\frac{1}{\sqrt{3}}\right)^{3}-\frac{1}{\sqrt{3}}\\ & \approx-0.39.\\ \end{align*}\] For \(x=-1/\sqrt{3}\) \[\begin{align*} y & =\left(-\frac{1}{\sqrt{3}}\right)^{3}-\left(-\frac{1}{\sqrt{3}}\right)\\ & \approx0.38.\\ \end{align*}\] Hence the stationary points occur at approximately, \(\left(0.58,-0.39\right)\) and \(\left(-0.58,0.38\right)\). Now we decide if these points are maxima or minima. Consider the tables below.
For \(x\approx0.58\) we have
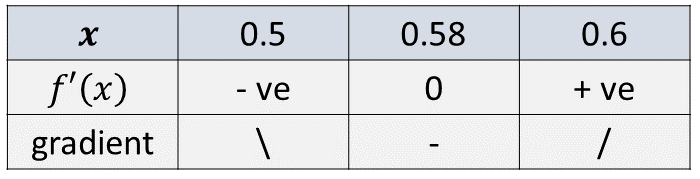
and so the point \(x=1/\sqrt{3}\approx0.58\) is a minimum.
For \(x\approx-0.58\) we have
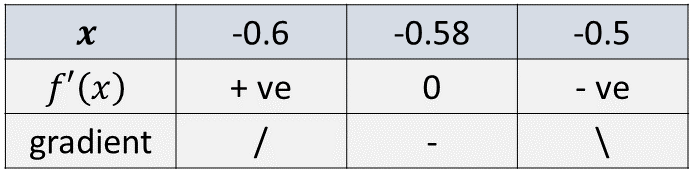
and so the point \(x=-1/\sqrt{3}\approx-0.58\) is a maximum.
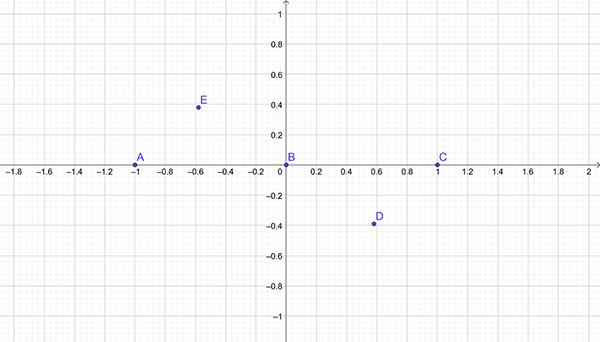
We can now graph \(y=x^{3}-x\). First plot the \(x-\)intercepts and the stationary points:
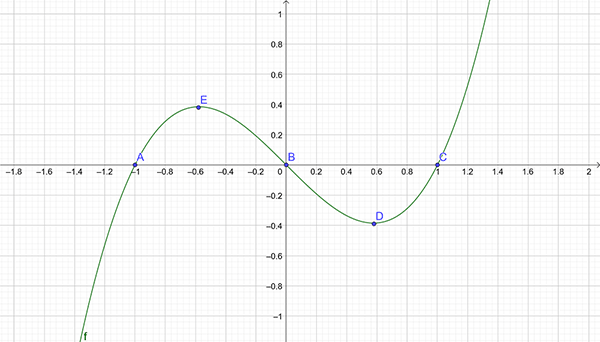
We know \(E\) is a maximum and \(D\) is a minimum and so can graph \(y=x^{3}-x\) as shown below.
Exercise
Sketch the graphs of the following functions showing all intercepts and turning points
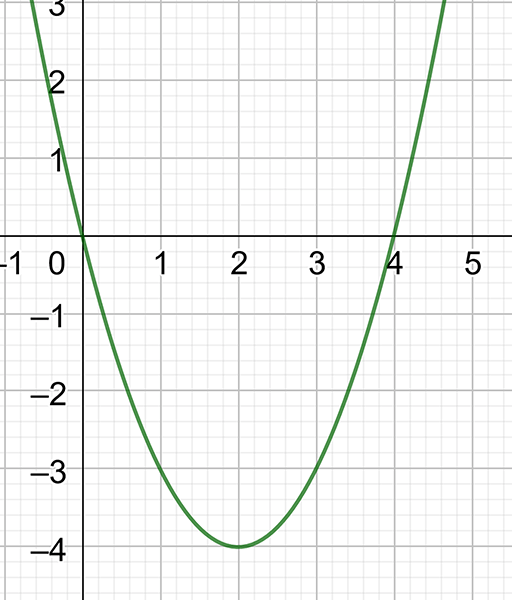
\(y=x^{2}-4x\)
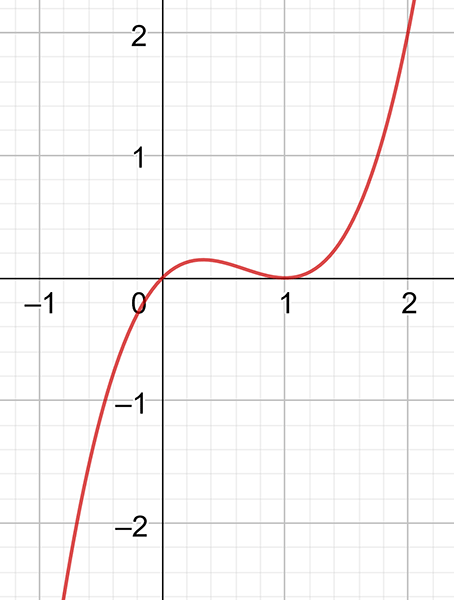
\(y=x^{3}-2x^{2}+x\)
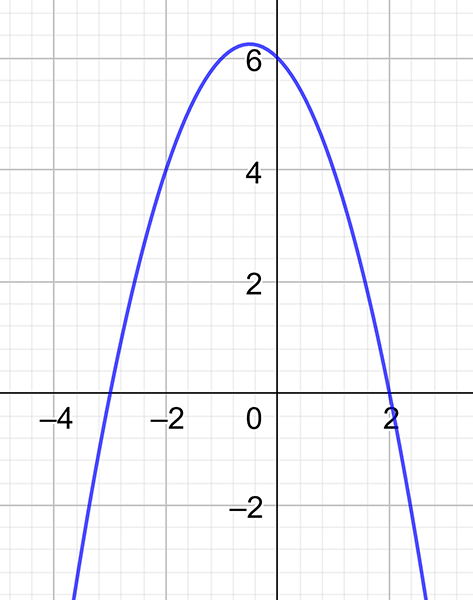
\(y=6-x-x^{2}\)
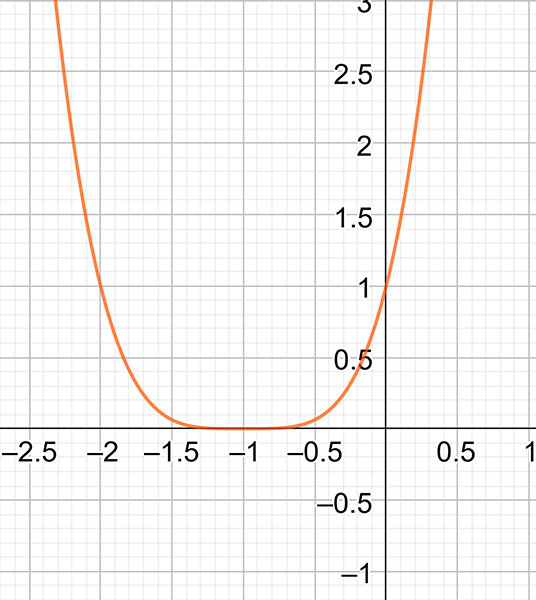
\(y=\left(x+1\right)^{4}\)
Download this page, D9 Curve Sketching (PDF 779KB)
What's next... D10 Rates of change